
National Housing Market 2020

The UK Residential Market
The latter half of 2019, and indeed most of the year in the UK residential sales market can best be described as stable and steady but mediocre. Both pricing and activity were subdued throughout much of the year and although limited house price growth is good for buyers, it has meant that speculative sellers have stayed away from listing, making the pool of potential available properties limited.
The RICS Residential Market Survey became progressively more downbeat as 2019 marched on, with each month showing fewer new instructions, fewer new buyer enquiries and fewer agreed sales. Much of the malaise during the year can certainly be attributed to uncertainty surrounding Brexit and the political climate more widely; this is further borne out by the RICS December survey which showed a sharply improved sentiment following the General Election. Our own experience was that thee was a gradual increase in buyer registrations during the latter half of 2019 and certainly into the final months of the year, particularly when compared with the same time in the previous year. This was probably due to a release of pent up demand in anticipation of clarity following the election. Along with this, the December RICS survey found a strong rise in new buyer enquiries across all regions, agreed sales up and sales expectations going forward much improved. This was also reflected in many of our own Carter Jonas offices where a notable increase in not just new buyer registrations, but market appraisals and agreed sales were up during in the final weeks of the year.
The lettings market meanwhile has had its own difficulties over the last six months; as the pace of private landlords selling their rental properties increased throughout the year, and buy-to-let mortgage approvals continued at all-time lows, the supply side has been squeezed. Demand however increases unabated, particularly in select parts of the country like London and the South. The result of a supply demand imbalance, together with the recent tenant fees ban, has been rising rents, in some cases at their fastest rate in many years.
OUTLOOK
The clear result of the General Election in December will be a boon to the property market; markets like certainty and this has already been reflected in not only our own Carter Jonas data, but the December RICS survey and higher rates of house price inflation reported in the November and December price indices. We anticipate a strong start to 2020 whilst pent-up demand from both buyers and sellers is satisfied. Also, as it is anticipated that stamp duty will increase from 15% to 18% for overseas buyers in the Spring Budget, we expect overseas buyers to be in a rush prior to this which will temporarily strengthen the London market and potentially ripple out into our regional markets. We expect both prices and market activity to strengthen in the next six months.
PRICING
During much of the latter half of 2019 house price growth had been quite muted and the trajectory was one of decelerating growth. However, by the last two months of the year there appeared to be a small but distinct turnaround in this path. Each of the three main indices (Halifax, HM Land Registry and Nationwide) show house price growth ticking upwards with annual prices now showing growth of between 1.4% and 4.0%, a marked increase over what had been the case just a few months prior. This uptick in inflation rates was also evident across many of the regions by the close of the year. Unlike much of the rest of 2019, just one region (East of England, -0.2%) posted a fall in values, with London’s house price growth in positive territory (albeit by just 0.2%) for only the second time in 12 months. Once again however the more affordable areas of the country posted the strongest growth over the course of the year with Wales (7.8%), West Midlands (4.0%), the North West (3.8%) and Yorkshire and the Humber (2.6%) at the top of the table.
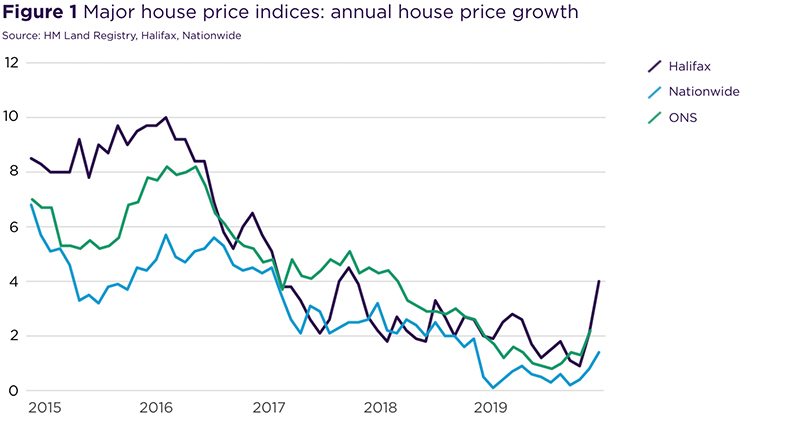
Source: HM Land Registry, Halifax, Nationwide
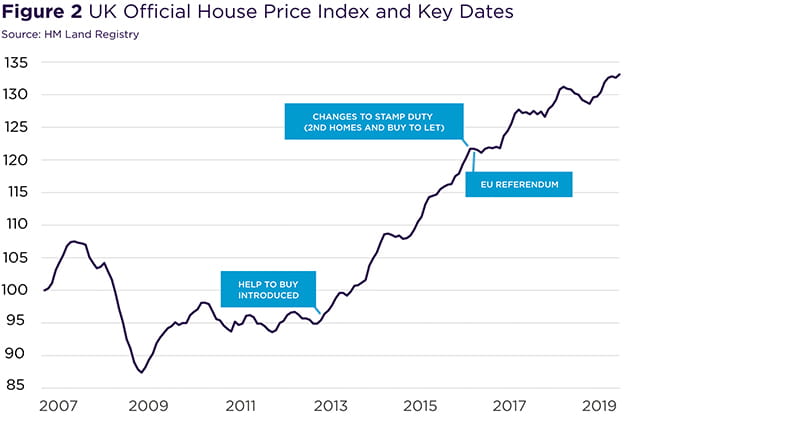
Notwithstanding the very recent house price growth acceleration, the pace of growth had been deteriorating quite rapidly since around the middle of 2016. This period coincides with the introduction of the additional stamp duty on second homes and buy to let investments in April 2016, and the EU Referendum held in June 2016. We believe that the slowing rate of growth over the short-term had been related to Brexit uncertainty and wider political uncertainty, with some of this abating now that the election has been concluded. However, over the longer-term affordability factors in some parts of the country are playing a part in slowing growth and will continue to do so until strong wage growth is sustained over a longer period, while overall inflation remains at or below the 2.0% mark.
ACTIVITY
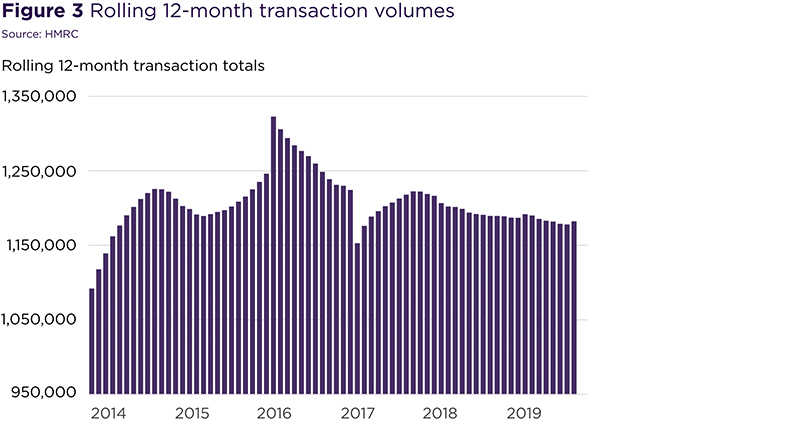
Transaction volumes during 2019 were down by just 1% over the same period last year, on a rolling 12-month basis. This reflects the general consensus that although available stock levels were lower than usual, this did not necessarily translate into vastly lower achieved sales. So while the uncertainty surrounding Brexit put off some vendors who might be speculatively selling, it did not necessarily mean that buyers were not serious about wanting to purchase, and we have seen this across many of our local areas as well.
During the late summer and autumn months the RICS residential market surveys noted growing uncertainty in the market amongst both buyers and sellers with new buyer enquiries and new instructions either declining or flat (supported by negative readings). What’s more, the survey found that during September, October and November 2019 there was a marked decline in market appraisals undertaken, indicating that the sales market may remain weak for some time. However, following the December General Election the RICS survey report found not only improved sales levels but an increase in market appraisals (as did we, at Carter Jonas) and an increase in transaction volumes in the early months of 2020 is now expected.
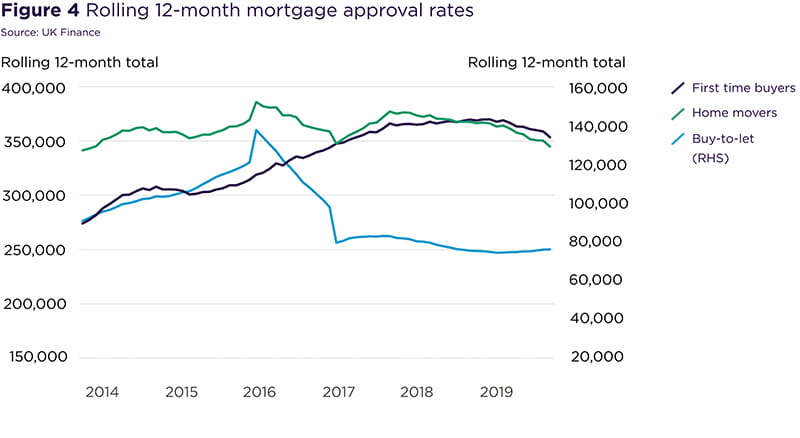
Monthly mortgage data as provided by UK Finance gives a more detailed look at who is buying and selling properties and indicates that during 2019 it was home movers who were the biggest retreating sector from the market as compared with 2018. Home mover mortgages were down by over 6% (annualised) in 2019 compared with first time buyers which declined by around 4% and buy to let which was up by 1%. This suggests that those that don’t have to move are the ones who found the wider market too unsettling and this is further borne out in Rightmove data which found nearly 15% fewer new sellers during November 2019, as compared with the previous year.
Looking at the data over a longer term and it is clear that first time buyers have now moved back into the market by quite some margin. During 2019 there were almost 16% more mortgage approvals to this group of buyers as compared with five years ago, while at the same time there are around 32% fewer buy to let mortgage approvals. Quite clearly the government interventions into the market such as Help to Buy and tax changes on second homes and on buy to let investments have had the effect of rebalancing the residential sales market to the benefit of first-time buyers. Indeed, mortgage approvals for first time buyers have now outstripped home mover approvals in each of the last 14 months, something which had not been seen since these records began in 2005.
THE LETTINGS MARKET
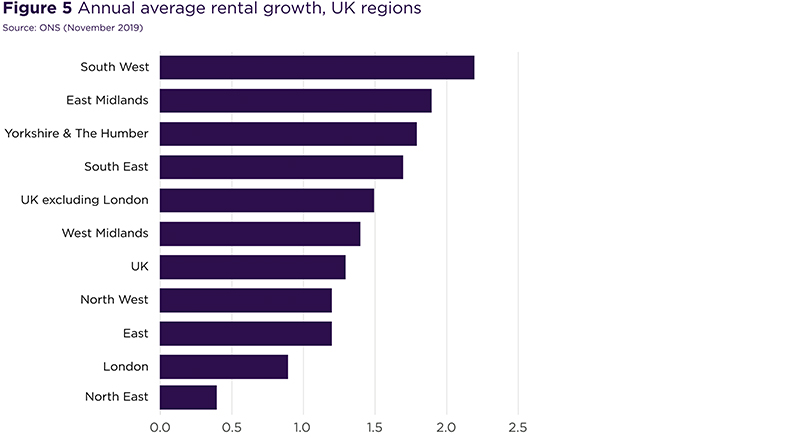
The UK private rental market continues to undergo a step-change with the last few years seeing several pieces of legislative and tax changes that have directly, negatively impacted the sector. As a result the lettings market during 2019 was characterised by growing rents amidst declining supply. ONS figures for annual rental growth in the private rented market suggest a UK average of around 1.2% with London rental growth being only around 0.9% through the year. Other indices however found much punchier growth rates, with the HomeLet rental index showing an average rental increase of around 2.6% across the UK, and 2.8% in Greater London. In any case, the biggest trend was the strong indication of an ever-shrinking supply side with private landlords continuing to leave the market.
The RICS Residential Survey notes that landlord instructions have been on a downward trajectory since 2016. Instructions fell nearly every month in 2019 with the pace of decline increasing as the year went on. Rightmove’s Q3 2019 rental report also noted the decline in available rental stock specifically citing recent changes in legislation including tax relief changes and the ban on tenant fees discouraging landlords from expanding their portfolios. The same report found that nearly a quarter of landlords expect to sell at least one property from their portfolios, citing the same legislative difficulties.
Going forward, it is difficult to see how the lettings market will change in any significant manner. Although the government has aimed to shift the lettings sector in the UK from an industry of patchwork, private landlord-driven units to one of a larger, institutional-led sector this will take some time to take hold. With around 4.5 million households currently in the private rented sector (English Housing Survey) and fewer than 150,000 build to rent units either completed or planned across the UK, it is clearly still a private landlord-dominated sector. What’s more, the traditional build-to-rent sector often charges higher rents than the smaller private landlord sector and this is not going to help those households who need more affordable housing.
Sources used in this publication: British Property Federation (BPF), Carter Jonas Research, English Housing Survey 2017-2018, Experian, HomeLet, HM Land Registry, HM Treasury Consensus Forecasts, Ministry of Housing Communities and Local Government (MHCLG), ONS, RICS, UK Finance.