

Central London Net Effective Rents Monitor Q2 2026
The Carter Jonas Net Effective Rents Index
Our Central London Net Effective Rents Monitor illustrates the combined impact of changes to both prime headline rents and the typical length of rent free periods across 22 central London districts.
The Index also reflects different lease lengths by providing analysis of five- and ten-year leases, which can have a significant impact on the net effective rent for each district.
Note: the impact of the timeframe for the ingoing tenant to carry out its fitting out works has not been factored into the Carter Jonas net effective rent analysis as the timeframe will be influenced by the quantum of space to be leased.
Key trends
Rental growth remained positive across central London's prime office markets in Q2 2026, although momentum eased from the previous quarter. Headline rents rose by an average of 0.2%, down from 0.8% in Q1 2026.
Rental growth was concentrated in the City of London's banking and insurance district, with rental levels largely unchanged across much of the remainder of the market. Although occupier demand remains resilient, wider economic and geopolitical uncertainty appears to have introduced a degree of short-term caution, weighing on leasing decisions and broader rental growth.
That said, a persistent shortage of Grade A accommodation relative to demand in the most sought-after locations continues to underpin rental growth despite a more cautious occupier backdrop.
Net effective rents outperformed headline rents slightly in Q2 2026, increasing by 0.3% on both five- and ten-year leases. This reflected a modest reduction in rent-free periods, particularly in East London, where strong leasing and pre-leasing activity has tightened availability and strengthened landlord negotiating positions.
On an annual basis, prime headline rents across central London increased by 1.5%, while net effective rents rose by 1.6% on both five- and ten-year leases. Although rental values continue to trend upwards, this represents the slowest rate of annual growth since Q3 2022.
Compared with the previous quarter, annual gains in net effective rents (5-year lease) have become less West End-led. Annual growth in 5-year net effective rents across the West End moderated from 6.1% in Q1 2026 to 2.2% in Q2.
By contrast, annual growth in net effective rents accelerated in the City of London and East London. In the City, this was driven by strong performance in the core banking and insurance district. In East London, stronger growth was primarily the result of a tightening in lease incentives in Canary Wharf.
Elsewhere, net effective rents held firm in West London, and the pace of growth slowed in both Midtown and South Bank.
Figure 1 illustrates the change in prime net effective rents in central London and its key submarkets over the last quarter and the last 12 months (to Q2 2026).
See our Q2 2026 London Office Market Report for further commentary on economic and geopolitical factors influencing the market.
Quarterly trends by submarket and district
Prime headline rents increased by an average of 0.2% across London's office submarkets in the three months to Q2 2026, marking a slowdown from the 0.8% growth recorded in the previous quarter. Net effective rents recorded marginally stronger growth of 0.3% on both 5- and 10-year leases, reflecting a reduction in rent-free periods in selected districts.
The City of London was the only submarket to record rental growth this quarter, with rents in the prime office segment up 0.6% from Q1 to Q2 2026. This follows the same rate of growth in Q1 2026 after three quarters of broadly flat prime rents.
Although prime rents across East London were broadly stable over the quarter, net effective rents increased by 0.7% on a 5-year lease and 0.9% on a 10-year lease. This was driven by a modest contraction in rent-free periods.
However, these gains have not been broad-based, with positive performance confined to a handful of districts. Rental growth in Q2 2026 was concentrated entirely within the City of London’s core banking and insurance district, where prime headline rents rose by 2.8% over the quarter. Ongoing competition for best-in-class space, particularly on the upper floors of tower buildings, has supported continued rental growth. The quarter's largest letting was recorded in the City, where financial services firm Lockton Companies signed a pre-let on approximately 250,000 sq ft at The Mark.
East London’s Canary Wharf district has seen a modest reduction in rent-free periods, indicating some tightening in market conditions, reflecting an uptick in letting activity. Even so, lease incentives remain above those seen across much of central London, with rent-free periods of 13–15 months on 5-year leases and 26–30 months on 10-year leases still common.
Elsewhere in central London, prime headline rents and lease incentive have shown little change. However, this should be viewed as a pause in momentum rather than a weakening in market fundamentals.
Annual trends
By submarket
Headline annual prime rental growth across central London moderated further in Q2 2026, increasing by 1.5% annually, down from 2.5% in the previous quarter. Net effective rents on a 5-year and 10-year lease rose only marginally faster than prime headline rents at 1.6%, indicating that rental growth has been driven primarily by increases in headline rents rather than material changes in lease incentives.
The West End remains one of central London's strongest-performing office submarkets, with prime headline rents up 2.2% year-on-year, in line with net effective rents (5-year lease) amid very little movement in typical rent-free periods. However, this is clear slowdown from 6.1% annual growth reported a year earlier and is below the 6.2% average recorded over the past five years.
The non-core West London submarket, bolstered by performance in the White City district, is now level with the West End for annual headline rental growth at 2.2%. However, 5-year growth has been modest compared with the stronger momentum seen in the West End. East London, led by Canary Wharf, follows closely, recording annual growth of 1.8%.
In West London, unchanged rent-free periods mean 5-year net effective rental growth has mirrored headline rents. By comparison, a modest shortening of rent-free periods in East London during Q2 2026 has supported stronger growth in net effective rents of 2.5% year-on-year. While this makes the submarket the best performer on an annual basis, this growth is from a lower base than the core central London markets.
In the City of London, annual headline rental growth accelerated to 1.3% in Q2 2026, up from 0.6% in the previous quarter. Net effective rents (5-year lease) increased at a slightly faster pace, rising by 1.6% year-on-year, compared with 0.9% last quarter. Yet, this is a significant drop from a peak of 8.4% annual growth in Q4 2024.
Midtown recorded more modest annual rental growth of 0.7%, level with net effective rental growth (5-year lease).
By district
Only eight districts recorded positive annual growth in Q2 2026, compared with 15 of the 22 districts in Q2 2025. This further underlines the extent to which activity is concentrated in a limited number of locations.
The West End’s Mayfair / St James’s district remains the strongest annual performer across all central London districts, although its rate of growth has slowed from 12.5% to 7.5% between Q1 and Q2 2026.
In other West End districts, Marylebone moved from 9.5% annual growth to 0% in Q2 2026, while Fitzrovia eased from 7.5% to 2.4%, as the strong rental gains recorded during 2024 and early 2025 dropped out of the annual comparison. This slowdown reflects limited leasing turnover rather than weakening fundamentals, with vacancy rates in both districts remaining comfortably below the central London average.
By contrast, the City of London’s banking and insurance district has seen a notable acceleration in annual performance, from 3.9% in the year to Q1 2026 to 6.8% in the year to Q2, 2026, making this the second highest-performing district.
East London’s Canary Wharf district has also strengthened. Annual growth increased from 4.5% in Q1 2026 to 5.7% in Q2 2026, while Crossharbour moved from 0% to 1.1%. This improvement reflects growing occupier confidence in the Wharf, supported by a series of major corporate commitments, including Barclays' acquisition of its headquarters at 1 Churchill Place and PwC's pre-let at One Eden. Alongside rising occupational costs and an acute lack of large floorplates in more central business districts, these have reinforced Canary Wharf's position as a competitive office location.
South Bank and Midtown’s Covent Garden all moved from positive annual growth last quarter to 0% this quarter, pointing to a broader loss of momentum outside the strongest-performing locations. Also, there has been limited transactional activity and a lack of new development in the City Fringe, resulting in continued flat net effective rents across all districts in the submarket.
Longer term trends
The change in net effective rents (expressed as an index) since 2020 across central London’s submarkets is shown in Figure 4. Prime net effective rents (5-year lease) across central London are now 21.9% above the bottom of the market in the first half of 2021, underlining the strength of the recovery in prime office rents since the pandemic.
The West End continues to outperform the wider market. Prime net effective rents on a 5-year lease are now 37.1% above their pandemic-era low, significantly ahead of all other submarkets. This reflects the sustained depth of occupier demand for the West End’s highest-quality accommodation. Although rental growth has moderated more recently, this follows an extended period of strong performance and comes from a considerably higher base than elsewhere in the market.
The core central London office submarkets continue to move beyond their previous rental peaks, with rising headline rents remaining the principal driver of growth in net effective rents across the prime market. Prime net effective rents are now 26.2% above their previous peak in the West End, 11.7% higher in Midtown and 9.6% higher in the City of London. In the South Bank, net effective rents are 20.7% higher. In contrast, despite recent improvements, the non-core markets of East London and West London have yet to fully recover, with prime net effective rents remaining 3.6% and 1.8% below their previous highs, respectively.
Outlook
Occupier demand trends
The Q2 data points to a prime office market that remains well supported, but where rental growth is becoming more measured and increasingly location specific. Occupier demand for high-quality, well-located and sustainable space continues to underpin rental values.
Importantly, this moderation largely reflects relatively slow market turnover, with constrained Grade A availability continuing to restrict occupier choice and leasing activity in key submarkets. A challenging global economic and political backdrop may also be contributing to delays in decision-making, although the full impact is unlikely to become apparent until late 2026 or early 2027, given the time typically required to shortlist new office space, negotiate terms and complete transactions.
Leasing activity continues to be supported by a broad range of occupiers. Financial services firms represent the largest source of demand in the pre-letting and newly developed building market, where occupiers typically secure best-in-class accommodation. This activity is concentrated in the West End and the City of London.
Furthermore, AI-related companies are a growing source of demand, reflecting the exponential growth of the sector. While the volume of space leased is not at the scale of the financial services and legal sectors, there have been several significant lettings. Notably, Anthropic and Humanoid collectively secured almost 200,000 sq ft at 1 Triton Square in King’s Cross, reinforcing the district’s position as one of London’s leading clusters for AI and technology occupiers.
Outlook for supply
Q2 was a bumper quarter for new office completions, with c.1.84m sq ft of office space delivered (over 25,000 sq ft in the West End and Midtown, and over 50,000 sq ft in the remaining central London submarkets). However, with 93.4% having been pre-let prior to completion, the influx of new supply has done little to ease availability pressures.
The development pipeline becomes increasingly constrained beyond 2026. Completion volumes from properties already under construction decline sharply, with a particularly pronounced dip in early 2027. If pre-letting activity continues at its current pace, occupiers are likely to face an increasingly competitive market with limited availability. Supply does not recover meaningfully until Q1 2028, although this does depend on there being no delays to construction timelines. As such, rental growth is likely to remain supported, particularly in locations where demand for best-in-class space remains strongest and future supply additions are limited.
South Bank has been removed from the City of London submarket calculation, resulting in minor revisions to previously reported figures for the City. As South Bank recorded no quarterly or annual rental growth to Q2 2026, it has been excluded from Figure 1. It has also been omitted from Figure 4 due to its relatively small size within the wider central London office market.
© Carter Jonas 2026. The information contained in this review is provided for general reference purposes only. While every effort has been made to ensure accuracy at the time of publication, no guarantee is given as to its completeness, reliability, or suitability for any particular purpose. We do not accept any liability for decisions, actions, or outcomes arising from the use of this data, including its use in business decisions or other formal proceedings. Any reliance placed on this information is strictly at the user's own risk. This data is not intended to replace professional advice. Users rely on this data at their own risk and should seek independent professional advice. Use of this data does not imply endorsement of any third-party conclusions.
Get in touch
- Loading...
- Loading...
Research and insights
 Read insight
Commercial Market Outlook
Our commercial market outlook, published by our research team, is continually being reviewed and updated with our latest insights.
 Read insight
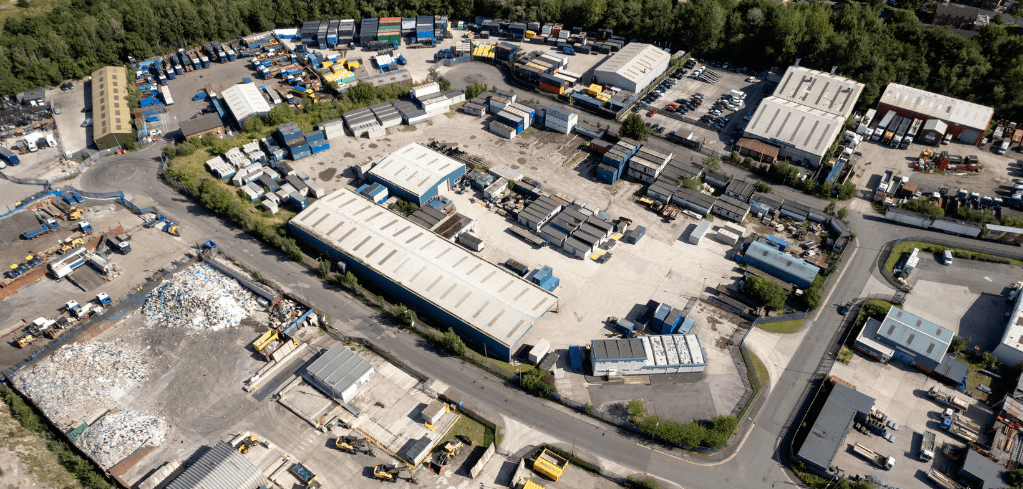
How much does it cost to develop an Industrial Open Storage site in the UK?
Discover the costs of developing an Industrial Open Storage (IOS) site in the UK. Get expert insights from Carter Jonas to plan your investment effectively.
 Read insight
Industrial Insights & Outlook | Autumn 2026
Explore Carter Jonas' Industrial Insights & Outlook Autumn 2026 for expert analysis, market trends, and forecasts shaping the industrial property sector this season.
Tailored newsletters for you
Sign up to our newsletter to receive further information and news tailored to you.